saved
The Inference Gap
Hraness cites a source capture. The source author remains the source.
SIGMOD Systems Award for Amazon Aurora · Creator of AWS SimSpace Weaver · Prev. Microsoft Research + Amazon Research · High-school dropout → MSCS + AI, @UW ·
The Inference Gap
Access to frontier models no longer guarantees access to the inference regime that can reliably reproduce frontier model capabilities.
On July 1st, Anthropic restored availability to Fable 5 after safety concerns briefly led the U.S. government to block access. Fable 5 was Anthropic's first Mythos class model and represented a step-change in frontier capability. And many, including myself, discovered we now had a model that could solve previously out-of-reach problems, over longer agentic horizons, and that exhibited an unusual level of intuition and judgment in its work.
Initially, Fable 5 was only expected to be available to subscription plan holders until July 7th. This deadline was inexplicably moved to July 12, and then July 19th. Each move happened with little notice and did not appear to be part of a coordinated plan. Major open-source releases and other frontier model price reductions seemed to be applying considerable competitive pressure on Anthropic. Finally, on July 17th, Anthropic announced that Fable 5 would remain permanently accessible to subscription plan holders from July 20th onward.
Between the announcement to offer Fable 5 permanently, and the days immediately following July 20th, I began experiencing what felt like a sharp drop in performance. The model appeared to have difficulty consistently following instructions. Guidelines and rules were sometimes ignored or violated. Architecture and design work began to show befuddling gaps in logical reasoning. I found myself sometimes expending dramatically more effort to achieve the same result. And even then, I could not always reliably recover the performance and intuition I experienced from the model in those opening weeks.
On July 30th, I started digging into the minified source for Claude Code to find answers. By August 1st, I had written the first version of semantically aware proxy that began transparently collecting live data from the wire.
I half-expected to find some sign that the model had been "nerfed", or that I was being silently rerouted to a less capable model. After all, its nearly become a cliché to hear claims like this following a frontier launch. People will marvel and share the amazing things they can create with a new frontier model. And a after a week or so, the timeline starts to fill with buzz and rumors of the model being nerfed, being served quantized model weights, or users being routed to a different model altogether.
Instead of finding a nerfed model, after six weeks of reconstructing wire logs, parsing transcripts, analyzing output tokenization, and staring at data, I found a much deeper issue. The model identity had remained the same, but the inference regime being delivered behind that model had not.
This produced two substantive findings, and these led to additional surprising and frankly alarming implications, which will be covered towards the end.
Even under the highest user-selectable effort settings, the amount of thinking the model actually performed was unusually small and fragmented, especially compared with inference regimes used to showcase frontier performance in headline benchmarks and demonstrations.
The delivered inference regime was unstable and non-stationary throughout; it fluctuated substantially, and its overall level markedly declined over the entire observation period.
As you read through the findings and evidence below, here's the thread to carry with you: inference effort, and the broader inference regime available to the model, may be the most consequential performance-bearing resource in AI. Access to or denial of the regimes you see in benchmarks, dazzling lab demonstrations, and early launch periods, may determine your access to frontier capabilities. This access can dictate whether frontier capabilities can be reliably reproduced, whether they become an order of magnitude more expensive to obtain than headline rates convey, or whether a previously successful result can even be reproduced at all.
What was measured
The corpus analyzed in Charts 1-5 comes exclusively from Fable 5, at xhigh and max effort levels, during sustained production work across a diverse set of projects and workloads. Data was aggregated from transcripts and live wire logs across 48 distinct Claude Code versions ranging from version 2.1.197 through version 2.1.263, with 97.9% of records containing version metadata.
The dataset spans 65 active-usage days, between July 1st and September 7th, 2026, collated from three machines, two subscription accounts, 25 project groups, and 213 recorded sessions. The primary comparison period ran from July 1 to August 31.
It contains 43,261 discrete Fable 5 model invocations, with quantified thinking totals for 43,007 of those invocations, and 7,853 complete assistant turns through September 7th.
The July-August base population for Charts 1-4 contains 6,921 complete turns and 36,374 quantified invocations. Individual charts apply the exclusions stated in their subtitles or annotations.
Detailed reconstruction, inclusion rules, chart definitions, derivations, and external sources are documented and published separately. The purpose of the above is to provide a guide for what data resides in the corpus.
Invocations and turns
The forensic analysis of model invocation and assistant turn data is a primary focus of the displayed charts and the associated findings. As such, it is important to understand how these terms are used and what they mean.
A turn is a single request submitted by a user, or client, that triggers one or more model invocations through an API, and ends in a terminal response. A single turn may contain a single invocation and its response, or comprise several discrete invocations.
A single invocation's thinking token count represents an uninterrupted sequence of reasoning steps performed by the model during a turn. When a user asks the model to think deeply about a hard problem, or generate a difficult result, this uninterrupted reasoning sequence is a consequential resource in the model's ultimate performance. We will revisit this concept again.
A single turn's thinking token count is a total derived by summing the thinking token counts of any invocations that comprised that turn. Many turns contain only a single model invocation and its response, and in these cases the turn's thinking token count is precisely equal to the thinking token count of this single invocation.
When a turn results in multiple model invocations, its thinking may be spread across them. A single turn in a coding harness may contain invocations that span reads, writes, tool calls, observations, and interleaved thinking. And as we will see, turn thinking can be incredibly fragmented across model invocations. Each invocation may contribute partial thinking to the overall turn, if thinking was performed at all. In these situations, a key quantity to watch for is how much of the thinking was performed by the longest thinking invocation in the turn.
Importantly, although invocations and turns can both contain thinking token counts, these two quantities should not be considered interchangeable. An invocation's thinking token count represents an uninterrupted sequence of reasoning steps applied toward a particular problem. Thinking across a turn that spans invocations can be spread between deciding what to read, deciding what to write, coordinating tool calls, absorbing tool responses, planning, synthesis, and coordination overhead. Whether a turn's summation of fragmented or shallow thinking can be considered equivalent to a longer uninterrupted reasoning sequence remains an open question. As we will see towards the end, published benchmarks provide strong evidence about the likely answer.
Higher effort regularly produces little thinking
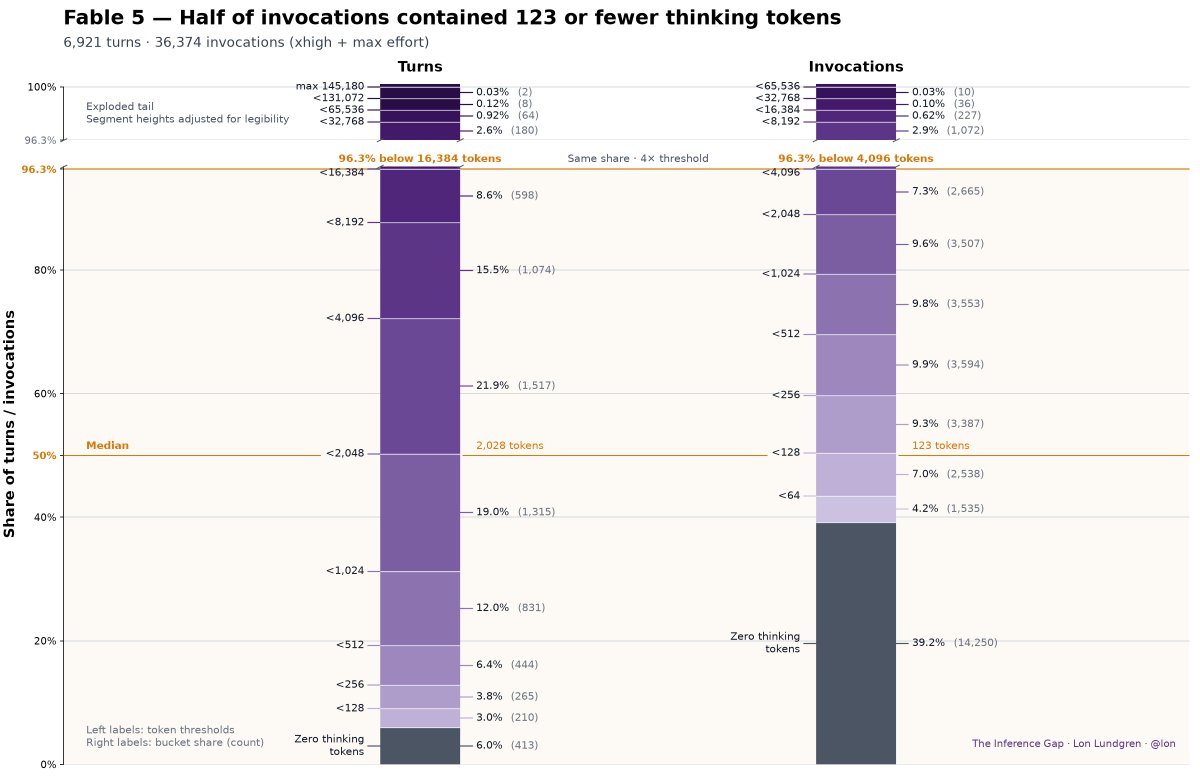
Several things stand out in this first chart, but a few numbers are worth explicitly taking notice of and discussing.
Half of all invocations delivered no more than 123 tokens of uninterrupted sequential thinking. I n 39.2% of invocations, the model performed no thinking at all.
Taking multi-invocation turns into account, half of all turns received no more than 2,028 thinking tokens. Thirty percent received no more than 971, and 6% contained no thinking at all.
To put these numbers in perspective, it is useful to look at what Anthropic publicly discloses about thinking and effort levels. While Anthropic is careful to qualify effort as a "behavioral signal" and not a strict token budget, here is what their documentation says about the xhigh and max effort levels in particular:
xhigh: Claude "always thinks deeply" with extended exploration.
max: Claude "always thinks", with no constraint on thinking depth.
Source analysis was performed on 500 published Claude Code versions, across 512 reconstructed version records, in order to understand thinking behavior. The resulting history of thinking in Claude Code, its fixed thinking budgets, steering keywords, effort levels, and today's adaptive allocator is worthy of its own writeup. Anecdotally, a few historical waypoints are worth mentioning. These are not full bisections, so some capabilities may have first appeared ahead of these dates.
| Date | Version | Detail | | --- | --- | --- | | Mar. 15, 2025 | 0.2.44 | Keywords selected fixed-thinking budgets of 4K, 10K, or 31,999 tokens | | Mar. 18, 2025 | 0.2.47 | Users could explicitly override the fixed budget with any positive integer | | Sept. 29, 2025 | 2.0.0 | Claude Code removed the 4K and 10K tiers, leaving only the 31,999-token ultrathink tier | | Feb. 5, 2026 | 2.1.32 | Claude Code first constructed adaptive-thinking requests for Opus 4.6, with Anthropic later stating activation occurred Feb. 9 | | Feb. 18, 2026 | 2.1.47 | The numerical effect of ultrathink disappeared while the still-visible keyword had no identified request effect | | Mar. 4, 2026 | 2.1.68 | ultrathink returned as prompt steering rather than an enforceable thinking budget | | Mar. 16, 2026 | 2.1.77 | Opus 4.6 gained an undocumented 127,999-token fixed-thinking path when adaptive thinking was disabled | | Apr. 16, 2026 | 2.1.111 | Opus 4.7 introduced xhigh and made the frontier adaptive-only, with no supported fixed-budget path |
Jumping back to the chart, 80% of invocations received 1,074 or fewer thinking tokens, while corresponding turns received 5,653 or fewer. Only once we reach the upper 12% of turns does aggregate thinking break 8,192 tokens. At the same percentile, invocation-level thinking still remains at 1,860 or fewer tokens.
By the time we reach 96.3% of the corpus, invocations still fall below 4,096 tokens of uninterrupted sequential thinking, while turns remain below 16,384 aggregate thinking tokens. And the buckets immediately beneath those thresholds are only seen across 7.3% and 8.6% of invocations and turns, respectively.
Above this, we enter truly rare air. There are strata at the next rung that breach those thresholds 2.9% and 2.6% of the time, respectively. But the distribution then collapses rapidly into thinking results that occur less than once in 100 observations, once in 1,000, and ultimately only a handful of times across tens of thousands of model interactions.
As we will see later, rarely seen buckets align with xhigh and max effort levels captured in published frontier benchmarks. These benchmarks establish how inference regimes correspond to frontier performance, and the non-linear relationship between inference regime and marginal benchmark improvement. The median invocation thinking counts shown here can be as far as 6-8 doublings in thinking token count from values that appear in those benchmarks.
Thinking fragmentation grows with turn size
Wrapping your head around the implications of this chart's findings may take a moment to crystallize. But once you see its connection to longer-horizon work and its later relationship to benchmark performance, it's hard to unsee.
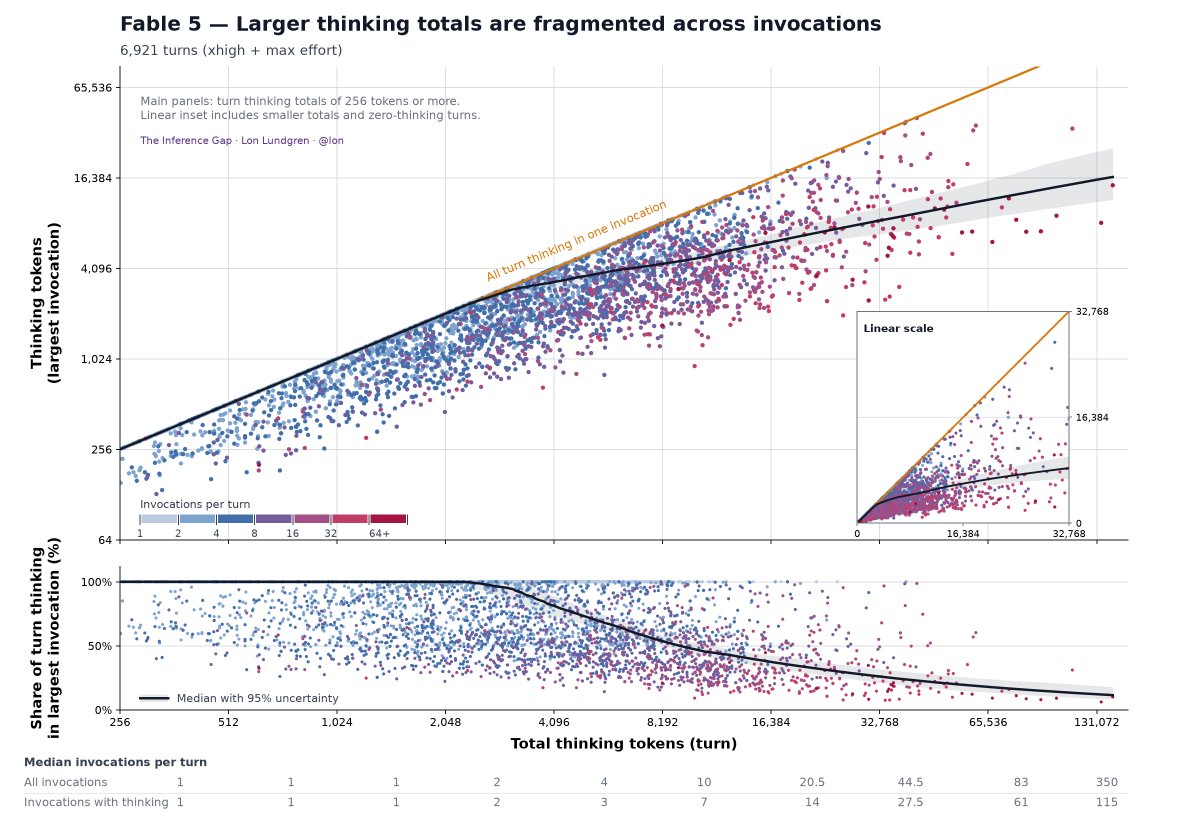
As turn-level thinking totals grow, the longest uninterrupted sequence of reasoning steps performed by the model accounts for less and less of the turn's thinking. This relationship is non-linear, and sequential reasoning growth does not keep pace with overall turn thinking growth. Accumulated thinking totals therefore substantially overstate the magnitude of sequential uninterrupted thinking that occurs within any single turn request.
Beginning around 2,500 turn-level thinking tokens, its longest invocation starts accounting for a rapidly declining share of its total thinking. As thinking totals grow, thinking begins to fragment over an increasing number of invocations. At the largest turn-level thinking counts, the longest uninterrupted sequence accounts for less than 20% of the turn's thinking. The remainder is distributed across dozens, and eventually more than one hundred, thinking-bearing invocations, within turns that can span hundreds of invocations overall.
This is best illustrated with a short table:
| Turn-level thinking tokens | Largest invocation's share | Thinking in largest invocation | Thinking elsewhere in turn | Median invocations per turn* | | --- | --- | --- | --- | --- | | 2,048 | 99.9% | 2,046 | 2 | 2 | | 4,096 | 81.2% | 3,324 | 772 | 4 | | 8,192 | 53.6% | 4,393 | 3,799 | 10 | | 16,384 | 37.3% | 6,118 | 10,266 | 20.5 | | 32,768 | 26.0% | 8,515 | 24,253 | 44.5 | | 65,536 | 17.9% | 11,712 | 53,824 | 83 | | 131,072 | 12.1% | 15,923 | 115,149 | 350 |
Table values are derived from the fitted median relationship shown above.
*Invocation-count medians describe turns from the listed total up to, but excluding, the next doubling, matching the chart footer.
A turn reporting 32,000 thinking tokens rarely contained anything close to one 32,000-token sequential reasoning invocation. Among turns in the 30,000-39,999 thinking token range, only 10.6% had an invocation that reached 80% of its turn's thinking.
As such, many longer turns are likely to look like the following:
One invocation may contribute a longer stretch of thinking, but it need not occur at the beginning. Among longer turns with at least four invocations, roughly half reached their largest thinking invocation fourth or later.
These trajectories may be useful. Observations returned by tools can improve net decisions, and the entire sequence is casually connected. But it cannot be considered equivalent to 32K of uninterrupted autoregressive deliberation.
The distinction becomes essential when attempting to recover equivalent uninterrupted sequential reasoning capability through other means. These techniques typically involve fanout by spawning subagent teams and fleets, choosing best-of-N by rolling out additional candidates, or simply letting an agent run longer until it reaches a goal state.
Those strategies can add breadth and accumulate aggregate work. But they do not necessarily reproduce missing sequential depth. Many shallow attempts can search more of a solution space, but they can also repeatedly enter the same basin without generating the longer chain of reasoning needed to escape it. Working costs and elapsed time spent achieving the same outcome can become multiplicative compared to a single deep sequential reasoner. And even after this additional cost and time expenditure, the enterprise can ultimately still end in failure to achieve the desired outcome.
We will visit this theme again when we discuss frontier benchmark data. Ultimately, model access and inference-structure access increasingly appear to be two different things, and access to one does not automatically confer access to the other.
More input doesn't produce proportionally more thinking
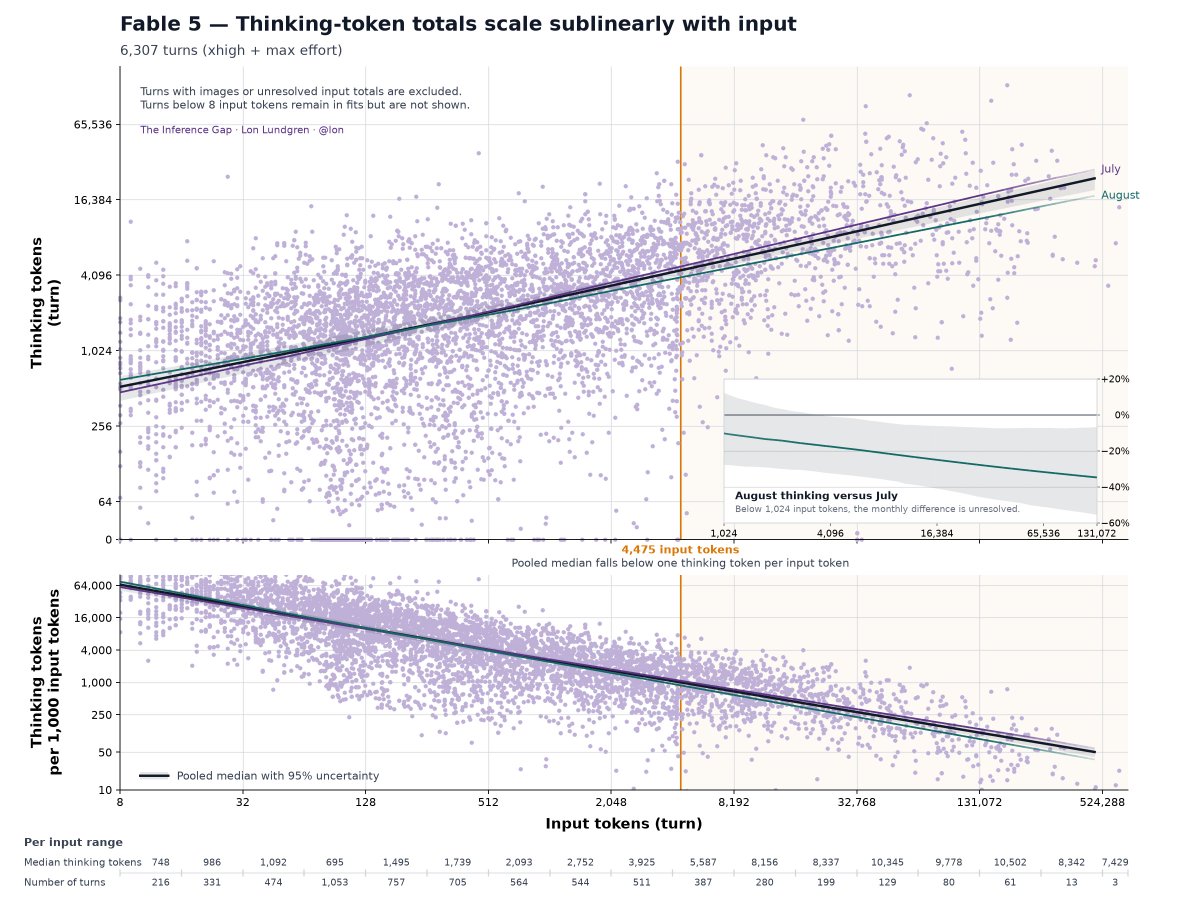
This chart asks: as the volume of incoming material increases, how much thinking accompanies it? It tokenizes incoming messages, tool results, and recorded text attachments and sums tokenized counts across each turn's invocations, explicitly excluding turns with image attachments. This measures text received during the turn, not the full context window or billed input, which would inappropriately include conversation history repeatedly carried forward.
Two categories of input growth are specifically worth mentioning, because both carry an expectation that thinking growth continues to scale proportionally with input size.
user-supplied instructions, guidelines, specifications, document/file attachments, or the like
accumulated state from supplied input, previous actions, tool observations, and the like, across agentic tasks
We observed that thinking increases with incoming text size, but does not keep pace with it. A 32-fold increase in incoming text, from 4,096 to 131,072 tokens per turn, corresponds to only a ~3.5-fold increase in median thinking. There is progressively less thinking per unit of material received. And at 4,475 input tokens, the relationship falls below one thinking token per input token.
This phenomenon can best be thought of as a form of reasoning dilution.
Another short table best illustrates this behavior:
| Input tokens per turn | Median thinking tokens | Thinking tokens per 1,000 input tokens | | --- | --- | --- | | 1,024 | 2,639 | 2,577 | | 4,096 | 4,336 | 1,059 | | 8,192 | 5,551 | 678 | | 16,384 | 7,122 | 435 | | 32,768 | 9,164 | 280 | | 65,536 | 11,806 | 180 | | 131,072 | 15,179 | 116 |
Table values are derived from the fitted median relationship shown above.
The implications of this phenomenon are potentially manifold. And while it is appropriate to draw your own conclusions, this phenomenon anecdotally lines up with several curious behavioral observations.
more detailed input specifications, including larger document bundles, and larger codebase reads leading to increased logical inconsistencies in presented designs and solutions
longer-horizon agentic tasks resulting in less faithful completion of the goal, including incomplete work, work not matching the documented or agreed to design, or statements about results that did not exist
longer prescriptive guideline additions intended to correct model behavioral quirks leading to overall decreases in guideline adherence
a general increase in input size mapping to a perceived reduction in instruction following
This is also the first chart where we quantify a month-over-month decline. At comparable incoming text totals, the monthly fitted median estimates that August had approximately 18% less thinking at 4,096 input tokens, 25% less thinking at 16,384, 32% less thinking at 65,536, and 32% less thinking at 131,072 input tokens. At each of these input totals, the monthly decline holds across the full 95% uncertainty interval.
This was the first sign that the inference regime had not merely been small. It had changed across the observation period. We qualify this change in the next chart's sensitivity analysis before diving into a more detailed temporal analysis.
Monthly decline survives sensitivity analysis
A changing corpus surfaces an obvious objection. Perhaps August contained different projects, longer sessions, busier days, or a different mixture of invocation-heavy work. A raw month-to-month comparison could confuse a change in workload with a change in delivered thinking.
This chart addresses those objections by reweighting the turn population several ways and then presenting a separate invocation-level comparison.
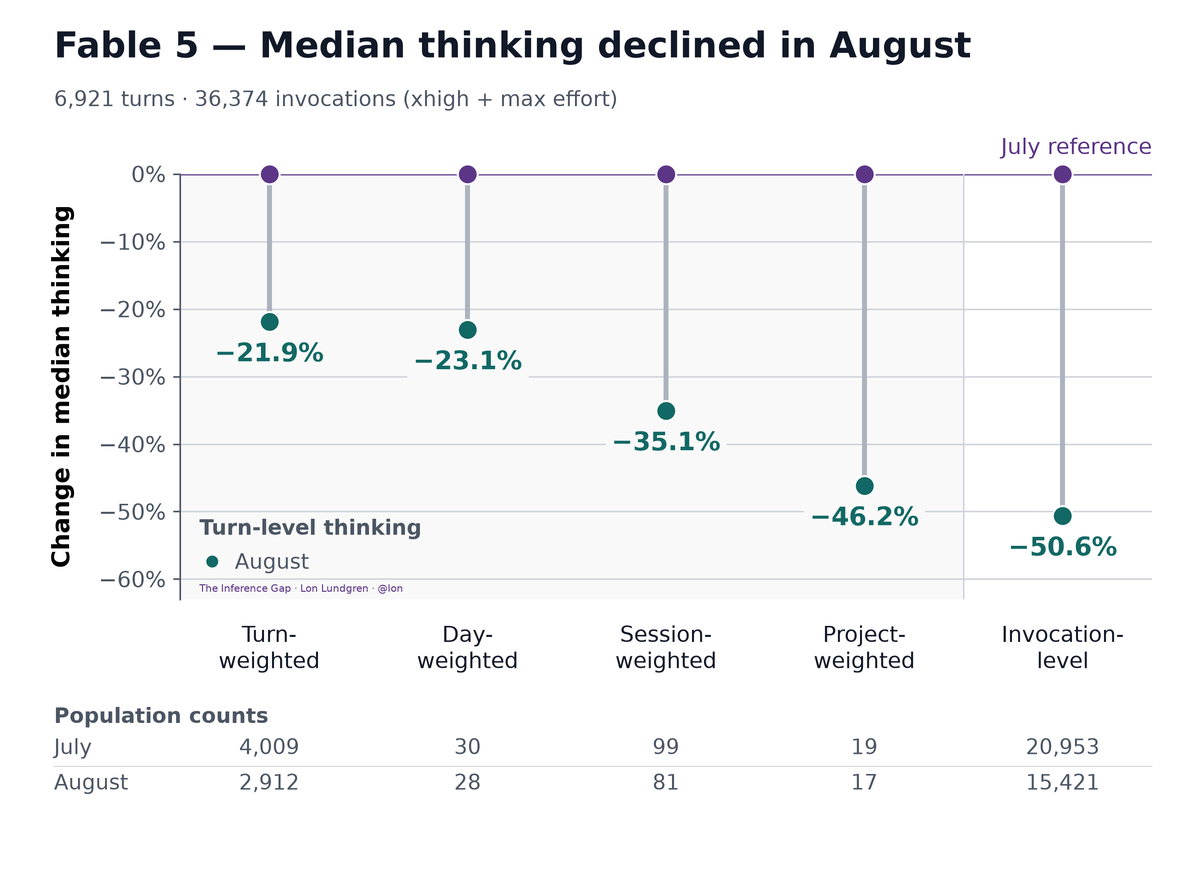
Turn-weighted: every turn counts equally
Day-, session-, and project-weighted: each named group receives equal total weight within its month, so groups producing more turns don't automatically dominate
Invocation-level: a separate comparison of individual invocations, not another weighting of turn totals
Another brief table illustrates the findings:
| Comparison | July median thinking tokens | August median thinking tokens | Decline | | --- | --- | --- | --- | | Turn-weighted | 2,301 | 1,797 | 21.9% | | Day-weighted | 2,340 | 1,800 | 23.1% | | Session-weighted | 3,062 | 1,988 | 35.1% | | Project-weighted | 3,480 | 1,873 | 46.2% | | Invocation-level | 156 | 77 | 50.6% |
Turn-based rows are weighted medians of individual turn totals, group medians were not averaged. The invocation-level row is calculated directly from invocations.
These estimates need not be identical. They answer different questions about what should count as the typical unit of experience.
What's important is that every comparison points in the same direction. The decline does not disappear when busy days, long sessions, or large projects are prevented from dominating the result. The separate invocation-level comparison shows the largest decline of all.
This month-over-month view establishes the direction of the change in delivered thinking. The subsequent timeline analysis establishes how the decline unfolded and, perhaps more consequentially, that the delivered inference regime itself was temporally unstable.
Delivered thinking is unstable and declining
This chart requires a bit of contextualizing before we can jump into the details, because it has rich implications and several consequential behaviors unfold concurrently.
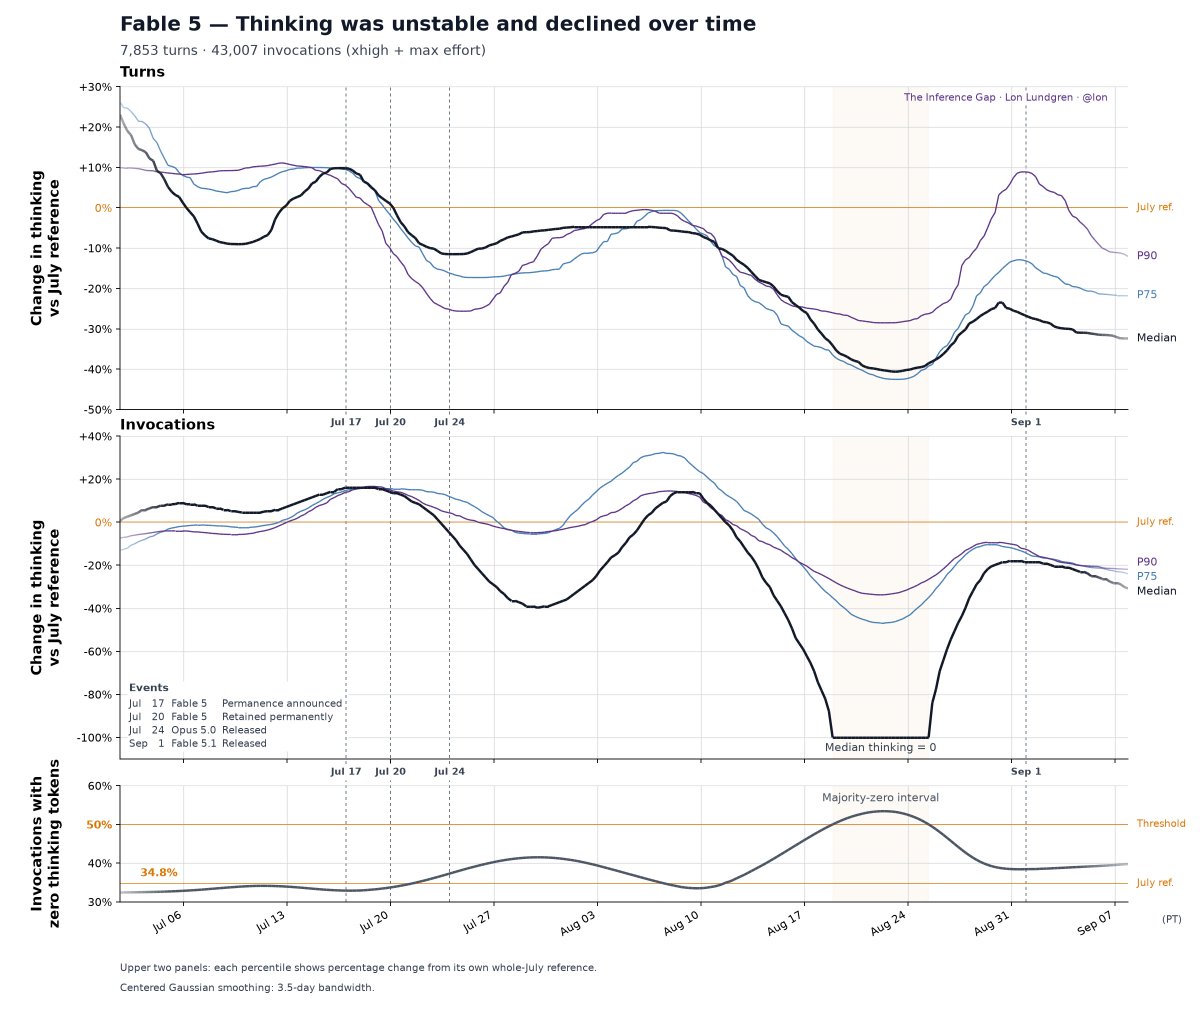
The upper two panels show changes relative to each percentile's whole-July reference value. The bottom panel shows the percentage of invocations that were delivered zero thinking tokens.
Importantly:
A median line at -40% means median thinking is 40% below its July reference.
Percentile lines can cross because they have different reference values, not because a P75 actually exceeds a P90.
These are smoothed estimates; their bends do not identify exact dates of underlying changes, but we do discuss temporal episodes and their findings below.
Although this investigation began after a perceived drop in performance around the July 17 decision to make Fable 5 permanently available to subscription plan participants, the chart was intentionally researched and produced as a July-vs-August reference comparison. Key dates are identified on the chart to provide product chronology; their relationship to nearby is yours to interpret.
What matters is that the chart establishes something meaningful without pointing at the exact mechanism:
The same advertised effort setting did not correspond to a stable amount of delivered thinking over time.
Over time, thinking declined through repeated downturns and partial recoveries. Around August 22-23, median turn thinking was roughly 41% below its July reference, while median invocation thinking literally dropped to zero. This episode persisted for roughly a week and shows trough alignment with turn thinking percentiles.
Importantly, the picture shown across the chart's duration is not solely confined to medians. Upper percentiles of accumulated invocation and turn totals also decline through the study period. The entire distribution, represented by six percentile series and a separate zero-thinking invocation share, is non-stationary with turning points roughly aligned over time.
There is a later recovery toward September 1, but median invocation thinking remains 18.6% below July levels and median turn thinking remains 27.5% below July. This recovery subsequently turns downward again, and the study period is carried through September 7 to show this downturn and provide contextual room around the Fable 5.1 product launch.
A separate analysis was performed to identify if episodic peak and trough behavior was predictive of whether invocations received zero thinking across the corpus. We examined multi-day rises and falls using a fitted zero-thinking rate across individual invocations during the study period. We then repeatedly removed random subsets of invocations to test whether episode locations and widths persisted.
At this multi-day scale, eighteen turning points and seventeen complete episodes were identified. Eight of these episodes had a sufficient population of overlapping projects to perform the matched ensemble comparison you see below. Only eligibility determined this core, not whether it produced favorable results.
Within each of these eight episodes, we learned the temporal pattern from an ensemble of projects and tested whether this ensemble improved predictions for a held-out project. Projects took turns being held out, and multiple ensemble combinations were tested, using equal project weighting.
A brief table illustrates the findings:
| Projects supplying temporal prediction | Prediction improvement: quadratic baseline | Prediction improvement: cubic baseline | | --- | --- | --- | | 1 | -30.62% | -30.59% | | 2 | -11.58% | -11.99% | | 3 | +1.45% | +1.22% | | 5 | +3.32% | +2.95% | | Remainder projects: 5-11 | +4.11% | +3.71% |
Percentages measure reduction in log loss. Quadratic and cubic refer to alternative fits of the broader time trend.
The takeaway is that a transferable signal was identified across ensembles that strengthened with ensemble size and performed poorly on average when making predictions between individual project pairs. Combining unrelated projects provided a prediction that transferred to held-out work. Individual projects were unreliable predictors of other projects.
This suggests a key implication observed across the corpus and raises the possibility of similar systemic behavior beyond the captured corpus and study period, potentially across user populations:
Ensemble predictions support a shared temporal component in the delivered inference regime that is distinguishable from project-specific variation and suggestive of an external process.
Nothing discussed thus far proves that a release or announcement caused a nearby change, nor does it establish whether behavior arose from capacity management, policy changes, routing, adaptive effort logic, or some other internal mechanism.
They do, however, establish something material to the overall thesis that matters without resolving the mechanism at play:
Instability is operationally consequential, regardless of which mechanism produced it. It makes behavior more difficult to predict, results harder to reproduce, systems harder to evaluate, and failures harder to diagnose.
This next chart finally connects those dots by looking at frontier benchmark performance and its closely defined relationship to inference regime. It establishes how that relationship holds at the invocation level and how it extends to long-horizon agentic work.
The Inference Gap, defined
We finally look at the inference regimes behind published benchmarks, their relationship to advertised frontier performance, and what they imply about the thinking-token populations delivered during the study period.
We focus on ARC-AGI-2 and HLE, two popular benchmarks model providers use to establish the frontier performance behind their newest models. These two choices are important since both have known input and output sizes, make no tool calls, and produce an answer after a single model invocation. They show the uninterrupted sequential reasoning regimes used to deliver frontier results.
Providers have increasingly retreated from reporting direct numerical reasoning values and now rarely disclose one clean number called "thinking tokens". Older evaluations would sometimes explicitly state a fixed thinking budget or realized thinking token counts. Newer system cards more often report reasoning effort settings, task costs, total-token budgets, or aggregate agent expenditure.
That shift in reporting is itself part of the problem. The resource is performance-bearing, but its quantity is becoming less directly observable to the people expected to rely on it.
The reporting of "reasoning effort" is still valuable, as it is the single user-selectable knob that most directly maps to an advertised inference regime and its particular benchmark outcome. When you hear that a frontier model produced a meaningful score on ARC-AGI-2 or HLE under xhigh or max effort, this reasonably becomes the baseline expectation for the inference regime available to you when choosing the same setting.
Specific thinking-token values by benchmark and effort level were taken from direct usage reports where available and otherwise reconstructed from reported cost, input, cache, output, and invocation-count evidence. Where possible, estimates were triangulated across multiple sources and independent reconstruction routes. The inferred values are central estimates rather than exact counts. Sensitivity checks across plausible assumptions preserved their ordering and kept them within the same token-doubling bands shown in the figure. Historical fixed-thinking controls formerly available in Claude Code are also shown for reference and provide strong anchors for these estimates.
This qualification becomes necessary when we examine the stark difference between delivered thinking-token populations and advertised inference regimes.
A short table primes the discussion by looking at thinking token ranges for xhigh and max effort levels across Anthropic family models:
| Benchmark | Fable 5.1 • (xhigh + max effort) | Fable 5 • (xhigh + max effort) | Opus 5 • (max effort only) | | --- | --- | --- | --- | | ARC-AGI-2 | 28.5K to 42.2K thinking tokens | 27.2K to 51.7K thinking tokens | 38.4K thinking tokens | | HLE | 20.1K to 31.3K thinking tokens | 11.6K to 21.1K thinking tokens | 19.8K to 26.0K thinking tokens |
This leads to a blended benchmark average of 24.4K thinking tokens at xhigh effort and 32.1K thinking tokens at max effort.
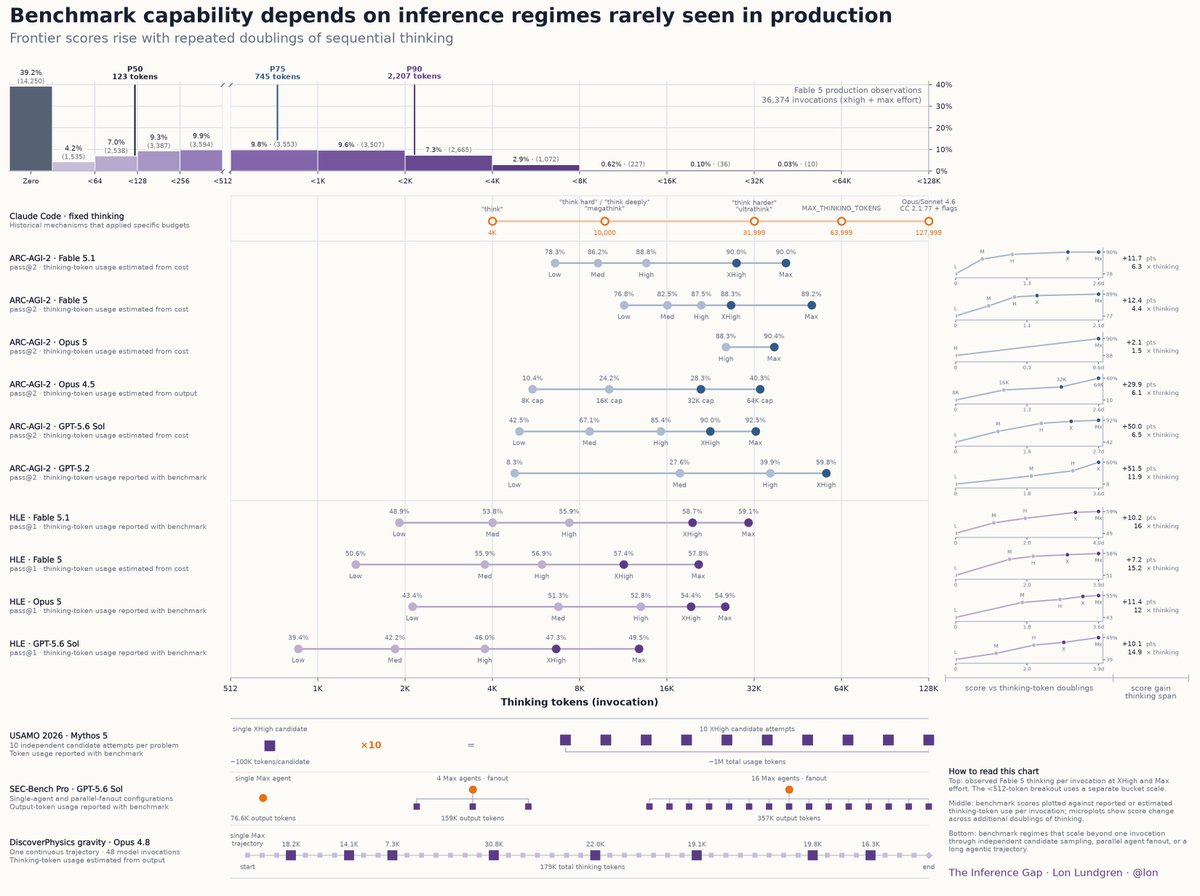
Taking our median delivered thinking token value of 123 tokens per invocation, at xhigh + max effort settings, we are 8 token-doublings away from reaching this range and it would require a 230x increase in token delivery to reach these levels.
It is important to keep in mind that each plotted value is already a benchmark-wide average across many tasks and candidate invocations, rather than an isolated extreme. Our observed median thinking-token delivery falls more than an order of magnitude below the lowest effort level recorded across every benchmark entry.
Even a the upper percentiles, P75 thinking remains roughly 38x short of the midpoint of the blended benchmark xhigh-max range, while P90 remains nearly 13x short.
To truly put these numbers in perspective, we need to start looking at the relationship between applied inference regime and benchmark scores.
Nearly every microplot shown to the right of a benchmark row shows benchmark performance declining at an accelerating rate as inference falls away from the highest effort levels. The performance curve is also nonlinear. Among benchmarks with the complete five-point progress from low to max, the plotted span averages 3.3 token-doublings and corresponds to a median benchmark-score increase of 11.45 percentage points.
This means that when a problem demands the best possible performance a frontier model can offer, a 20% or 50% increase over baseline is the wrong scale to consider. You should be thinking in multiples of the baseline, 4x or 8x, or more, not marginal increases.
Calling back to the study's numbers, we can extrapolate where our observed thinking percentiles might land on these benchmarks by extending the Low-Med slope in log₂-token space.
| Production percentile | HLE implied score | ARC-AGI-2 implied score | Token doublings from xhigh-max | | --- | --- | --- | --- | | P50 | 38.1% | 1.5% | 7.3 doublings | | P75 | 47.4% | 31.3% | 5.0 doublings | | P90 | 53.0% | 49.3% | 3.4 doublings | | Benchmark (xhigh) | 57.4% | 88.3% | - | | Benchmark (max) | 57.8% | 89.2% | - |
Because these are extrapolations from the nearest observed slope segment, they are estimates, and the true benchmark scores at these thinking budgets could only be obtained by rerunning each benchmark with its budget constrained accordingly -- a capability we do not possess. But the conclusion remains noteworthy:
Performance is roughly proportional to the logarithm of thinking compute, and shortfalls spanning several token doublings can impose a large, non-linear performance penalty.
This returns us to the argument introduced at the beginning:
[Access to frontier inference regimes] can dictate whether frontier capabilities can be reliably reproduced, whether they become an order of magnitude more expensive to obtain than headline rates convey, or whether a previously successful result can even be reproduced at all.
When combined with the temporal variability seen in the previous chart, sensitivity to inference depth explains why nominally identical access cannot guarantee reproducible capability.
The obvious response is to move beyond one invocation. Sample more candidates, fan work out across agents, or let an agentic trajectory continue longer. But these approaches do not eliminate the dependence on uninterrupted sequential reasoning. They, in fact, depend upon it.
The third benchmark example is the most instructive and most closely relates to our overall discussion and data. During one 48-invocation long-horizon task, the agent executed over 179K tokens of reasoning. Several large invocations occur and we note the eight largest on the chart. The top five invocations range from 18.2K sequential thinking tokens to 30.8K sequential thinking tokens in length. Notably, there are no invocations in this 48-invocation sequence that were delivered zero thinking tokens. Thinking is present throughout all 48.
By contrast, no single turn in the corpus received 179K thinking tokens. The largest turn received 145,180 thinking tokens and was fragmented across 344 invocations. Of 105 turns that reached at least 48 invocations, every one contained zero-thinking calls. In 95% of those turns, the longest-thinking invocation did not reach the fifth-largest invocation in the benchmark: 18.2K tokens.
The other two benchmarks tell a similar story. Best-of-N or parallel candidate generation does not succeed by having its per-candidate thinking starved of inference compute. Agent fanout uses coordination and topology to solve larger or more difficult problems, not to shortcut sequential reasoning. In fact, were such an endeavor to be undertaken, it would certainly be more expensive than simply allowing a similarly resourced single sequential reasoner to do the work.
Ultimately, these approaches can provide scale, allocating large budgets across multiple workers. Long-horizon research and engineering tasks can consume tens of millions, hundreds of millions, or even billions of aggregate tokens across repeated calls and contexts. But they cannot make up for shallow sequential thinking through rote repetition of shallow rollouts.
Ten million task-level tokens are not ten million uninterrupted reasoning tokens. Parallel sampling is not serial depth. A configured ceiling is not realized consumption. A normal user can receive a few hundred or a few thousand thinking tokens in one invocation while a laboratory demonstrates frontier capability using tens of thousands of sequential thinking tokens, millions of task-level tokens, hundreds of candidates, specialized verifiers, or coordinated fleets.
This is the meaning of The Inference Gap.
There are now two frontiers
The evidence suggests that we must distinguish two things that have usually been treated as one.
The model frontier is what the underlying model can do under a sufficiently favorable inference regime: deep reasoning, repeated attempts, search, tools, continuation, verification, and large aggregate budgets.
The accessible frontier is what a particular user can reliably elicit through the effort controls, reasoning allocations, context handling, rate limits, tooling, and budget actually available to them.
Historically, those frontiers were close enough that model access often served as a reasonable proxy for capability access.
That is becoming less true.
A consumer, researcher, or small company may technically have access to the same model that produced a spectacular result while having no practical way to reproduce the inference regime that produced it.
This creates an apparent paradox. Model capability per token can improve. Token prices can fall. Weights can become more widely available. Yet the cost of approaching the demonstrated frontier can remain high, or rise, if frontier results depend on inference regimes that require multiplicatively more compute or controls that ordinary users cannot invoke.
The frontier is becoming less about which model you can call and more about how much computation you can marshal behind that call, how it is structured, and whether you control it.
For reproducibility, a model name, version, prompt, and nominal effort setting are no longer enough if the realized inference regime varies.
For procurement, an organization can evaluate a system during one regime and deploy into another. A benchmark score produced with undisclosed or inaccessible compute cannot be assumed to describe the capability delivered in production.
For reliability engineering, changes in zero-thinking propensity and reasoning depth can appear downstream as intermittent regressions, inexplicable task failures, or unstable agent behavior.
For economics, the cost of hidden inference degradation can be displaced into retries, routing, parallel candidates, larger agent teams, longer runtimes, and human review. What looks like a modest reduction in provider-side compute can become a multiplicative increase in user-side cost.
And for competition, a frontier lab can combine a model with internal inference infrastructure that no ordinary customer or smaller company can approximate. Nominal access to the model does not confer access to the resulting system.
Where this leaves us
When we experience a perceived change in model performance, we should no longer ask the question: "Was the model nerfed?" and instead start asking "Under what inference regime was this model delivered?".
Without that information, “the model hasn't changed” is not a reproducibility statement. And “you have access to our frontier model” is not a complete description of the capability being delivered.
This calls for a new level of transparency from model providers and evaluators and justifies making the following reporting requirements the norm:
realized reasoning tokens per invocation
realized reasoning tokens per user-facing turn
maximum uninterrupted reasoning span
the share of invocations containing zero thinking
thinking distributions by effort level, not only averages
configured ceilings versus realized consumption
changes in those distributions over time
There is a closely related transparency requirement that should emerge around costs. Pricing itself becomes misleading when recovering advertised capability requires multiplicative additional expenditure. When capability falls below a threshold required for reproducibility, mechanisms for recovering costs become necessary when tasks result in otherwise avoidable failure.
One last cultural touchpoint is appropriate to mention as so much discussion of late has centered around the twin concerns of AI Safety and AI Regulation. The data and findings throughout this article should reframe these topics in practical and end-user-oriented ways.
Safety is about more than whether a model escapes containment and wreaks havoc. A model that acts without sufficient opportunity to deliberate is a safety concern. A model that drops production data or damages production systems is a liability. Liability arising from a provider-constrained resource may extend to the provider.
Regulation is about more than "Pacing the Frontier". Regulation can address transparency, provider disclosures, service reliability, and consumer guarantees. It can outline provider accountability and liability, and end-user relief that goes beyond restrictive provider ToS documents and arbitration clauses.
Both of these suggestions are implementable now, and are likely to find purchase across an electorate eager to see action in an otherwise Wild West-like industry. Neither requires a global consortium, coordination across competitors and borders, a ban on open-source models, or agreement on thorny issues related to AI welfare and consciousness.
My hope is that this body of work helps support at least one small step in that direction.
Intelligence may be getting cheaper. Models may be getting stronger. But the gap between what a model can do and what an ordinary user can reliably make it do can still widen. And if we are not mindful, that gap may become unrecoverable.
The model is now only half the system.
The inference regime determines how much of the frontier you get to see.
The difference is The Inference Gap.
Collection and analysis code grew out of a live research environment and is not yet packaged cleanly enough for release. Measurements are sufficiently defined now so other users with access to reasoning-token traces can begin testing the same questions against their own data.
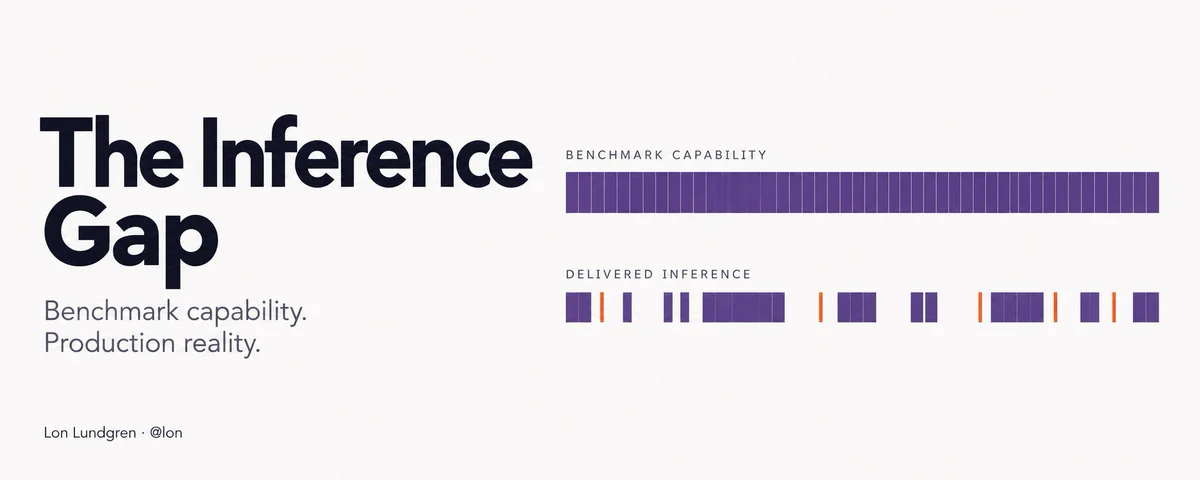
Cover: The Inference Gap. Subtitle: Benchmark capability. Production reality. Attribution: Lon Lundgren · @lon. Right side labels BENCHMARK CAPABILITY over a continuous purple bar and DELIVERED INFERENCE over a fragmented purple bar with orange tick marks in the gaps.
Chart 1 — Fable 5 — Half of invocations contained 123 or fewer thinking tokens. Subtitle: 6,921 turns · 36,374 invocations (xhigh + max effort). Left bar Turns median 2,028 tokens; 96.3% below 16,384. Right bar Invocations median 123 tokens; 96.3% below 4,096; annotation Same share · 4x threshold. Exploded tail segment heights adjusted for legibility. Turns buckets include max 145,180 0.03% (2); <131,072 0.12% (8); <65,536 0.92% (64); <32,768 2.6% (180); <16,384 8.6% (598); <8,192 15.5% (1,074); <4,096 21.9% (1,517); <2,048 19.0% (1,315); <1,024 12.0% (831); <512 6.4% (444); <256 3.8% (265); <128 3.0% (210); Zero thinking tokens 6.0% (413). Invocations buckets include <65,536 0.03% (10); <32,768 0.10% (36); <16,384 0.62% (227); <8,192 2.9% (1,072); <4,096 7.3% (2,665); <2,048 9.6% (3,507); <1,024 9.8% (3,553); <512 9.9% (3,594); <256 9.3% (3,387); <128 7.0% (2,538); <64 4.2% (1,535); Zero thinking tokens 39.2% (14,250). Footer: Left labels token thresholds / Right labels bucket share (count). The Inference Gap · Lon Lundgren · @lon.
Chart 2 — Fable 5 — Larger thinking totals are fragmented across invocations. Subtitle: 6,921 turns (xhigh + max effort). Top panel: Thinking tokens (largest invocation) vs Total thinking tokens (turn) on log-log scale with orange line All turn thinking in one invocation; color legend Invocations per turn from 1 to 64+. Linear scale inset. Bottom panel: Share of turn thinking in largest invocation (%) with Median with 95% uncertainty. Table Median invocations per turn — All invocations: 1, 1, 1, 2, 4, 10, 20.5, 44.5, 83, 350. Invocations with thinking: 1, 1, 1, 2, 3, 7, 14, 27.5, 61, 115. Notes: Main panels turn thinking totals of 256 tokens or more. Linear inset includes smaller totals and zero-thinking turns. The Inference Gap · Lon Lundgren · @lon.
Chart 3 — Fable 5 — Thinking-token totals scale sublinearly with input. Subtitle: 6,307 turns (xhigh + max effort). Note: Turns with images or unresolved input totals are excluded. Turns below 8 input tokens remain in fits but are not shown. Top: Thinking tokens (turn) vs Input tokens (turn) with July, August, and pooled median fits; orange callout at 4,475 input tokens: Pooled median falls below one thinking token per input token. Inset: August thinking versus July. Bottom: Thinking tokens per 1,000 input tokens vs Input tokens (turn); Pooled median with 95% uncertainty. Footer per-input-range median thinking and turn counts. The Inference Gap · Lon Lundgren · @lon.
Chart 4 — Fable 5 — Median thinking declined in August. Subtitle: 6,921 turns · 36,374 invocations (xhigh + max effort). Y-axis Change in median thinking from July reference 0% to -60%. August declines: Turn-weighted -21.9%; Day-weighted -23.1%; Session-weighted -35.1%; Project-weighted -46.2%; Invocation-level -50.6%. Population counts July/August: Turn-weighted 4,009/2,912; Day-weighted 30/28; Session-weighted 99/81; Project-weighted 19/17; Invocation-level 20,953/15,421. The Inference Gap · Lon Lundgren · @lon.
Chart 5 — Fable 5 — Thinking was unstable and declined over time. Subtitle: 7,853 turns · 43,007 invocations (xhigh + max effort). Three panels Jul 06–Sep 07 (PT): Turns change vs July reference for P90, P75, Median; Invocations change vs July reference with Median thinking = 0 episode; Invocations with zero thinking tokens with July ref 34.8% and Threshold 50%, Majority-zero interval shaded. Events: Jul 17 Fable 5 Permanence announced; Jul 20 Fable 5 Retained permanently; Jul 24 Opus 5.0 Released; Sep 1 Fable 5.1 Released. Footer: Upper two panels each percentile shows percentage change from its own whole-July reference. Centered Gaussian smoothing 3.5-day bandwidth. The Inference Gap · Lon Lundgren · @lon.
Chart 6 — Benchmark capability depends on inference regimes rarely seen in production. Subtitle: Frontier scores rise with repeated doublings of sequential thinking. Top histogram: Fable 5 production observations 36,374 invocations (xhigh + max effort) with Zero 39.2% (14,250), P50 123 tokens, P75 745 tokens, P90 2,207 tokens. Middle: benchmark scores vs thinking tokens for Claude Code fixed thinking, ARC-AGI-2, and HLE across Fable 5.1, Fable 5, Opus 5, Opus 4.5, GPT-5.6 Sol, GPT-5.2 with microplots of score vs thinking-token doublings. Bottom: multi-invocation regimes USAMO 2026 Mythos 5 ~1M total usage tokens; SEC-Bench Pro GPT-5.6 Sol parallel-fanout to 357K output tokens; DiscoverPhysics gravity Opus 4.8 single Max trajectory 48 invocations 179K total thinking tokens. How to read this chart notes for top, middle, and bottom. The Inference Gap · Lon Lundgren · @lon.